MeridianInformation Design
A report-led information design concept: infographics, visual explanations and a polished report layout.
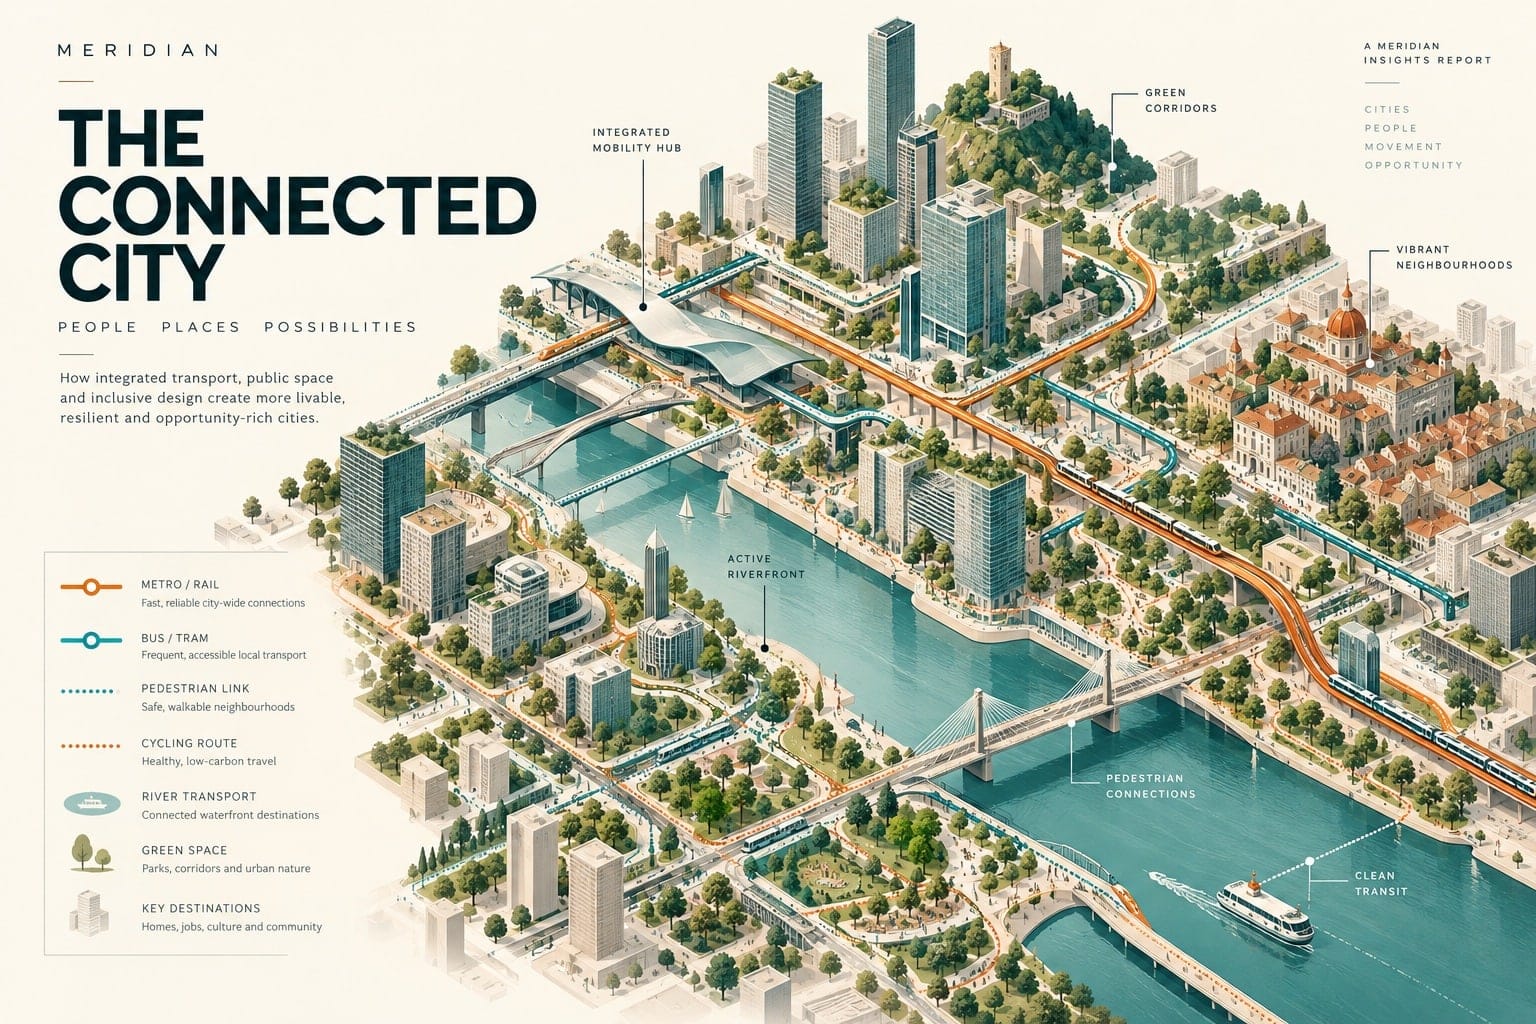
Self-initiated concept. The visuals are AI-generated art-direction concepts, not completed client work.
Intended audience
Readers of public or institutional reports who need complex topics made legible.
Creative objective
Explain systems through illustration and careful labelling, using only verified data for any numbers.
Visual direction
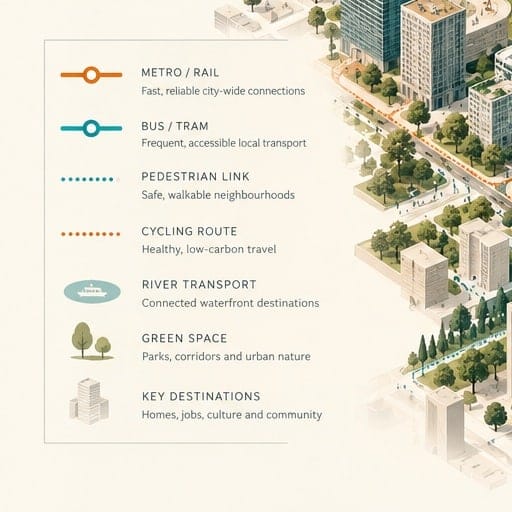
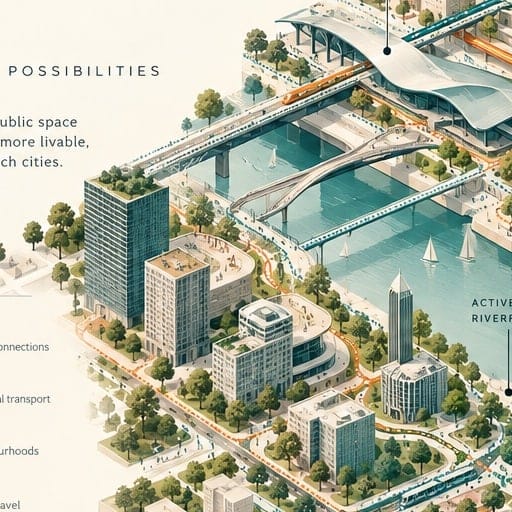
An isometric imaginary city with labelled transport pathways in teal and burnt orange on ivory, set with precise Swiss typography.
What the supplied preview demonstrates
One AI-generated art-direction still and a short animated preview that moves a camera across that still. Together they show composition, palette, typography and mood.
They do not show completed animation, working software or editable production files.
Animated concept previewProposed full production scope
Deliverables a real production of this concept would include.
- One infographic
- Report cover
- 4-page report layout
Production approach
Use verified client-supplied data for any quantitative graphic; otherwise explain through illustration rather than charts.
Suggested Production Stack
- Illustrator
- Figma
- InDesign
Tools proposed for producing the real deliverables. Their use is not claimed by the preview.
Branding & Editorial
Typography, palette & applications
A system that stays recognisable from the smallest application to the largest.
Typography
A clear typographic hierarchy with a distinctive display voice.
Palette
A restrained set of colours with defined roles.
Applications
Rules that carry the identity across print, screen and motion.
Detail views
Crops taken directly from the concept still.
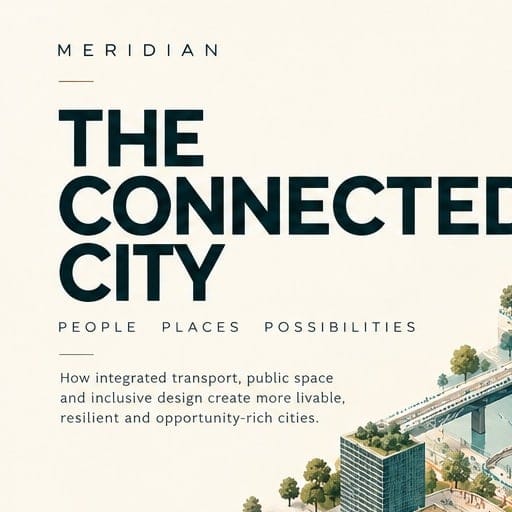
Palette sampled from the concept
- #F8F3E7
- #C3BEA9
- #9B9574
- #516951
- #6C968F
Related projects
Cause-based branding & fundraising
Evergreen — Nonprofit Campaign
- Branding & Editorial
- Photo & Image
- Digital Design
- AI Visuals